The net cash increase for the period is XXXX amount indicated in item number five it is a total of three activities operating activities investing activities and the financial activities cash at the end of the period this is going to be the total of cash of the beginning of the period in this example that was XXXX amount + the net cash increase that we just discussed of XXXX amount that gives us a total of cash at the end of the period of XXXX amount .go to the dashboard in report option and click all programs and scroll down and click statement of cashflow .the customize button this feature allows you to customize a number of areas of the report this includes general areas of the report as you can see here you can customize the rows and columns list the number and how they are formatted and the header and footer information here. now we are going to putting the date in cashflow and run the report.
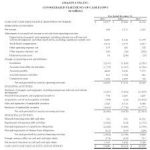
The statement of cash flows pulls several key numbers from both the profit and loss statement and the balance sheet.
Therefor it is very important that the following have taken place before you run a statement of cash flow
*Be sure QuickBooks is up-to-date with all income and expenses.
*Reconcile all bank and credit card account
*Resolve any discrepancies found in your review of the p&l statement and the balance sheet report.
*Make sure all assets and liabilities have been recorded in QuickBooks.
*Review your statement of cash flows on a monthly basis.
Account receivable aging report
(Balance sheets)let’s first start of when then with opening our report the accounts receivable report for which the accounts receivable aging report will be supporting or summarizing or giving more detail on once that’s open let’s go ahead and duplicate that up top mean a right-click the tab up top .ew are going to duplicate the tab up top. then we putting the date and run the report. now we are concentrating here on the account receivable account and we are shown what happened with the account receivable.
A company we can imagine that the owner of the boss of the company asking how much money do people owe us.and we look at the balance sheet we say five thousand to eighty-one fifty-two is how much people owe us. The next question the boss is gonna ask at the same point as the owners are going to ask is going to say well who owes us that money and how much.
we need to follow up with these people. and I want to just click on account receivable I am going to get our transaction detailed report.it’s giving us the transaction detail which is the invoice and the payment by date. (transaction report)let me want to know by the customer who owes us the money.
we are cheque isn’t sufficient for the accounts receivable reports I am going to go back to the summary and we go down the accounting and we go to the chart of accounts and you will recall the chart of accounts whenever we make an account and new account we have to group it by the account type and the accounts receivable.and again it’s processed.
We are going to the dashboard and click the report option we want to the customer balance detail and clicking this option then we get to the account receivable aging report. I am going to duplicate this tab.so now we have the detailed by customer.let;s back to our balance sheets report .who owes us that money. (account receivable option)and then we can take a look at the customer balance detail or summary report and if we get to the bottom line of this report it should be a summary report of the number on the balance sheet
So we have the five thousand two eighty-one for two back to the balance sheet.that’s the five thousand two eighty-one fifty-two .so we are taking that number breaking it out by who owes us the money.and then we can go back into our report here and we can basically follow up on who owes us the money.now when we are on the detail report.so within each customer it’s giving us the detail of that customer information.
AR and AP Graphs
We are open to the QuickBooks desktop and go to the report option-click and scroll down and choose the customer balance summary report. change the dates and run the report. this report in inform to our account receivable and account payable customer report. now this report data is export on excel to make a chart structure in the excel sheets this is AR report sheets .now go to back our dashboard and click the report option and open to the vendor balance summary report. I am gone to change the date top and run the report. This is going to be supporting the accounts payable report.there is our present the data I am gonna go ahead and right-click and export that to excel.open up excel sheets. there is all reports are presented in a graphical structure this graph structure is AP.